Atmospheric pressure is often used as an indicator of storm surge via the "inverted barometer" relationship:
As indicated here.
However, this does not work for the Canterbury coast.
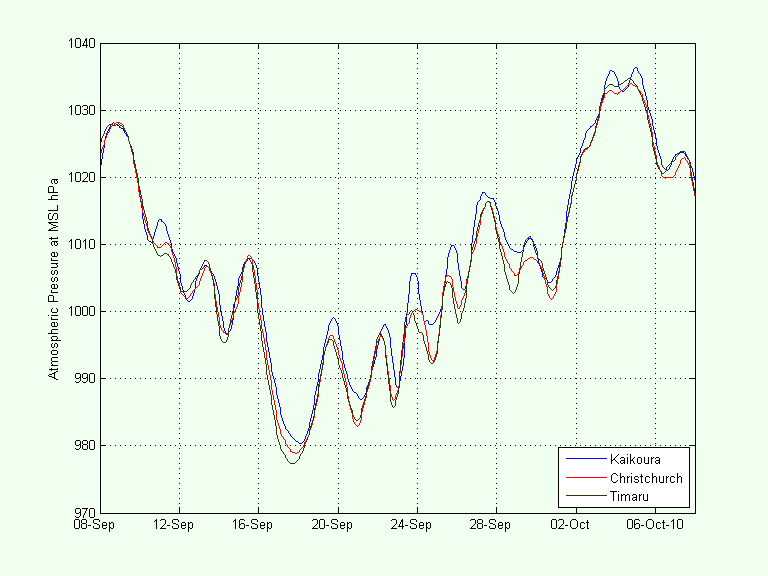
The figure to the left shows a month of atmospheric pressure from three sites along the Canterbury coast
from Kaikoura, south west down to Timaru, a difference of 2 deg in latitude and 300 km distance.
Mean atmospheric pressure decreases as we go into higher latitudes, but the variance or energy in the signal increases.
Thus, the pressure is generally higher at Kaikoura, but the pressure difference between peaks and troughs is
generally higher at Timaru.
Also, pressure systems, especially low-pressure systems, propagate, as evidenced by the trough on 18 Sep which
took 10 hours to travel from Timaru to Kaikoura, rising by 3 hPa as it did so.
However, these effects are only small and in general the shape of the curves are very similar. Therefore, all things being equal and if the inverted barometer relationship applied, we would expect storm surge to be similar from Kaikoura down to Timaru. However, this is not the case, as we will see.
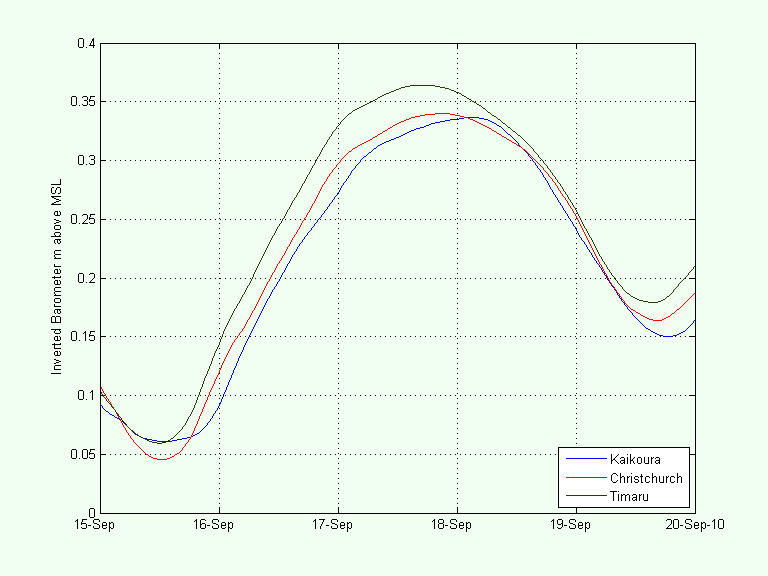
In this figure, the deep trough of low pressure of 18-Sep has been converted to inverted barometer, which of course becomes a crest in sea level.
If the inverted barometer relationship applied, we would expect a rise in storm surge of about 0.3 m from 15 to 17 Sep.
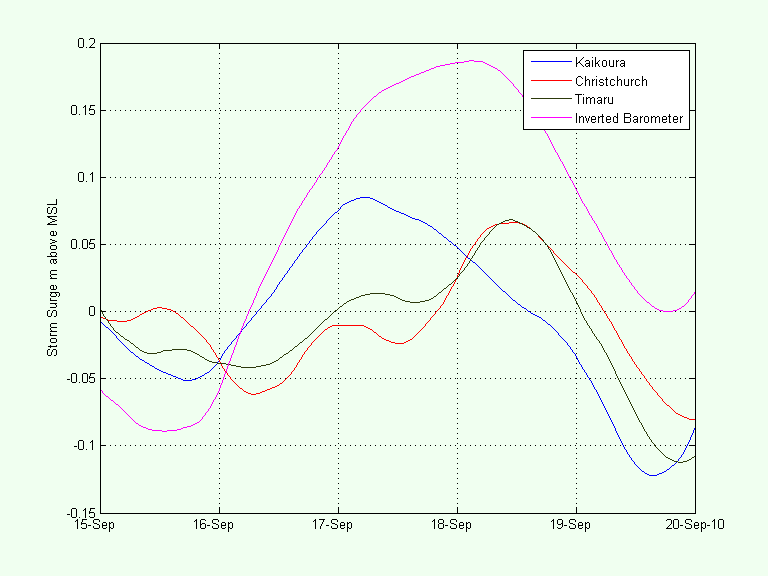
In fact, nothing like this happened to storm surge.
There was an increase of about 0.1 m, but the variation in inverted barometer bears little resemblance to the actual measured storm surge.
The broad crest in inverted barometer is not replicated in the storm surge at any of the sites.
And while the storm surge at Christchurch and Timaru look similar, the storm surge at Kaikoura is quite different.
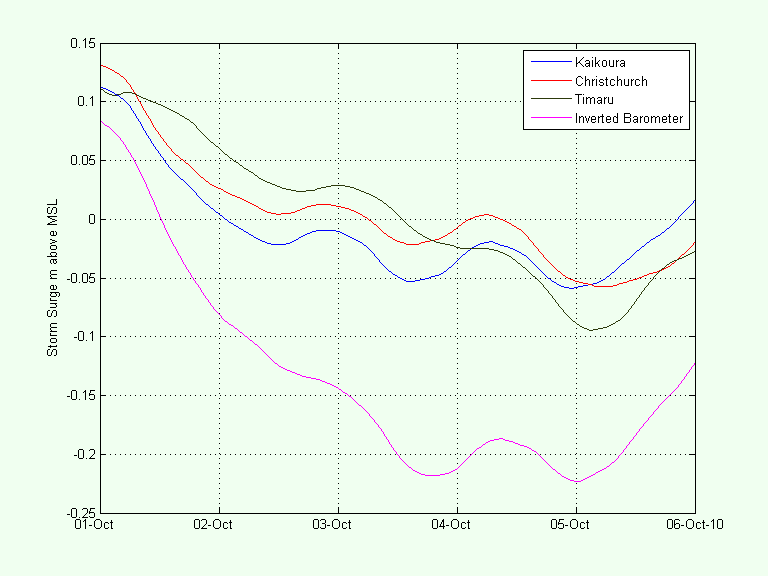
The same applies to the high pressure that occurred on about 4-Oct.
Inverted barometer indicates there should be a drop of 0.3 m in storm surge.
The actual drop was half this; though the fluctuations in storm surge between the sites is similar
and these fluctuations also occur in inverted barometer, only it is displaced downwards by about 0.2 m.
Unfortunately, the models of NIWA, MetOcean Solutions, and others do not perform well for storm surge on the Canterbury coast.
They essentially use inverted barometer with a small modification for wind effects.
But the plots shown here indicate that storm surge is not well modelled by the inverted barometer relationship.
So what is happening?
The answer is that large-scale ocean effects called continental shelf waves are affecting storm surge.
In the Southern Hemisphere, these waves, called Kelvin waves, propagate around continents or islands with the land on their left.
They are initiated by wind and driven by Coriolis forces.