 Microseisms at Port Levy
I have two Raspberry Shakes:
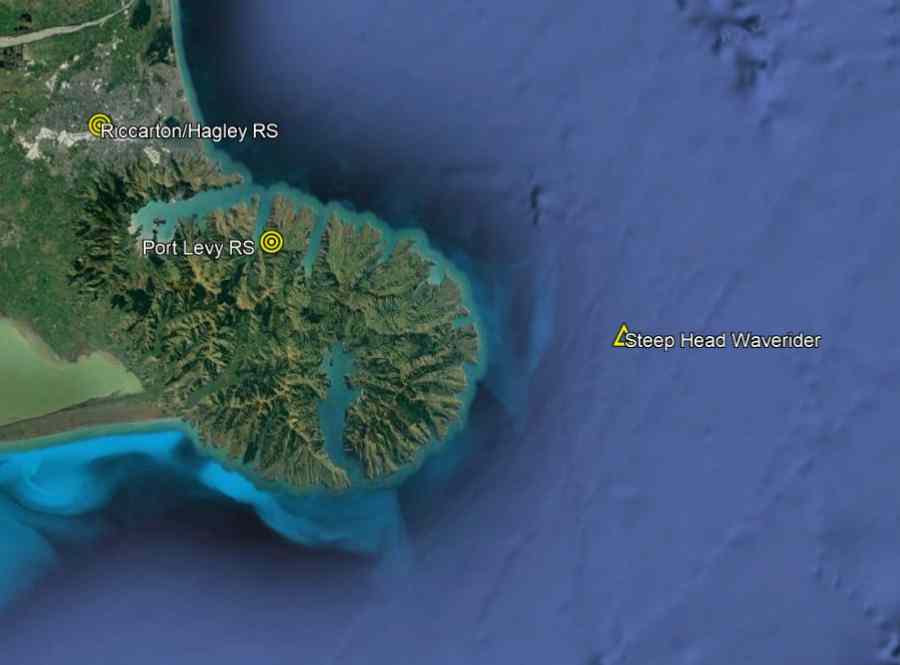
- Riccarton/Hagley RB009 on deep alluvium, 100 m from a busy thoroughfare (Deans Ave) in Christchurch.
- Port Levy RC144 on igneous rock, on Banks Peninsula.
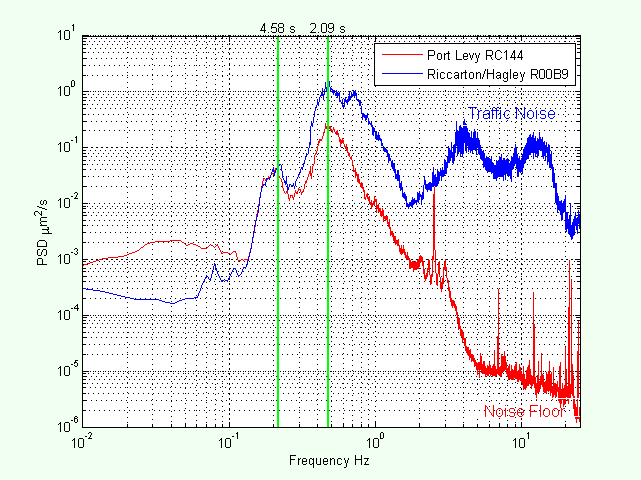
Recently, I was comparing the Fourier spectra for 3 hours over midnight on a Sunday night, a quiescent period when there are few trucks, boy racers, or cars.
For frequencies above 1 Hz:
- The Port Levy spectrum decays down to the noise floor of the instrument.
- The Riccarton/Hagley spectrum decays to 2 Hz, then rises representing noise caused by traffic.
But what intrigued me was the bumps in the low frequency part of the spectrum at 2.09 and 4.58 s period.
Spikes like this in the spectrum usually indicate some sort of resonance - oscillations at the natural frequency of the medium.
What can these be?
And why are they aligned? The sites are 23 km apart and are on completely different bed material.
There appears to be some background phenomenon that is causing the instruments to "hum".
Microseisms
A Google search revealed the phenomenon of
microseisms
, which are the "hum" I've observed in my Raspberry Shakes.
The most likely cause is ocean waves causing changes in pressure on the sea floor that are transmitted through the Earth's crust as Rayleigh waves.
Well, let's check this out by comparing the hum with ocean waves measured at a nearby wave buoy.
Steep Head Waverider
The Steep Head waverider buoy is situated 17 km off the eastern end of Banks Peninsula (as shown in the map above) where it monitors waves coming
from storms in the Southern Ocean as well as ex-tropical cyclones propagating down the east coast of New Zealand. It is run by
NIWA and ECan, who kindly supplied
the data for 2018 for me to play with.
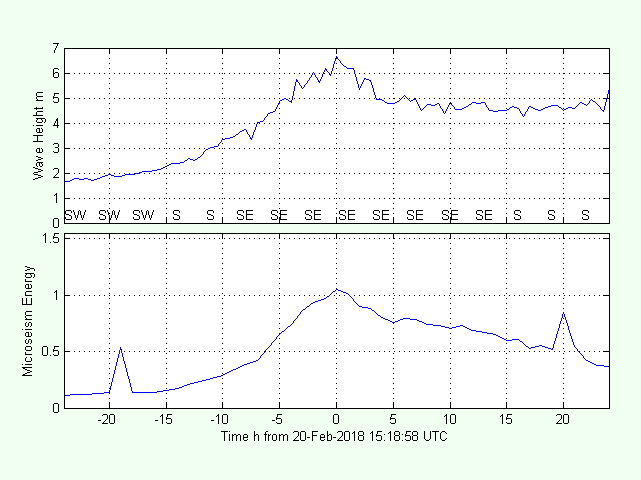
This plot shows the wave record in the upper panel and the energy in the hum measured at Port Levy in the lower panel.
This was the largest wave event in 2018. The waves were from the S and SE.
The microseism energy is calculated as the area under the Fourier spectrum from 2 up to 10 s periods.
The hum energy has units of micrometers squared per second squared, but the absolute numbers don't mean much, so let's not worry about that.
The hum record shows close correlation with the wave record, indicating a direct relationship between the waves and the measured hum.
However, for none of the other 15 events when the waves exceeded 4 m in height was there such a clear-cut relationship.
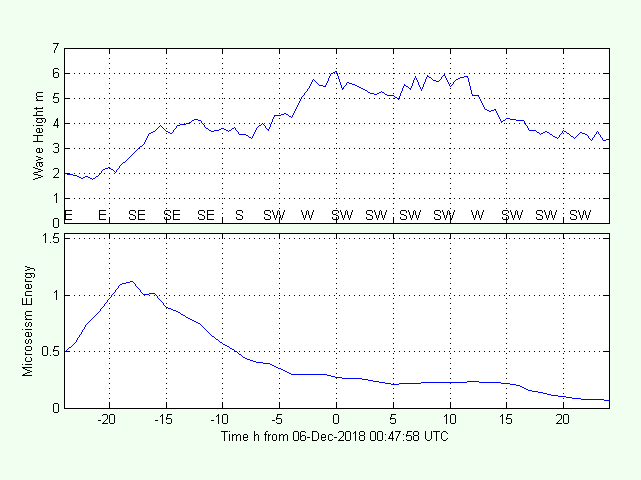
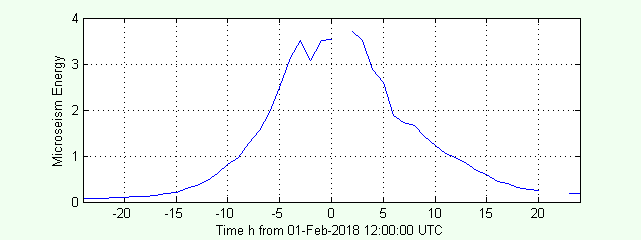
For example, here is the third largest wave event for 2018.
In this case, the peak in microseism energy occurred 18 h before the waves arrived at Steep Head.
So things are not that simple..........
We need to look a bit wider for an answer.
Maybe the source of the microseisms is further away. That would explain why the peak in the hum occurred before the wave peak.
Swell Maps
Maps of the swell waves around New Zealand can be obtained from the global wave model
NOAA WaveWatch III. The model forecasts wave conditions every 6 hours.
The initial conditions for these runs called "analyses" are a best estimate of current wave conditions.
Mulgor downloads these data every day and stores them in a database which can be used to plot swell maps.
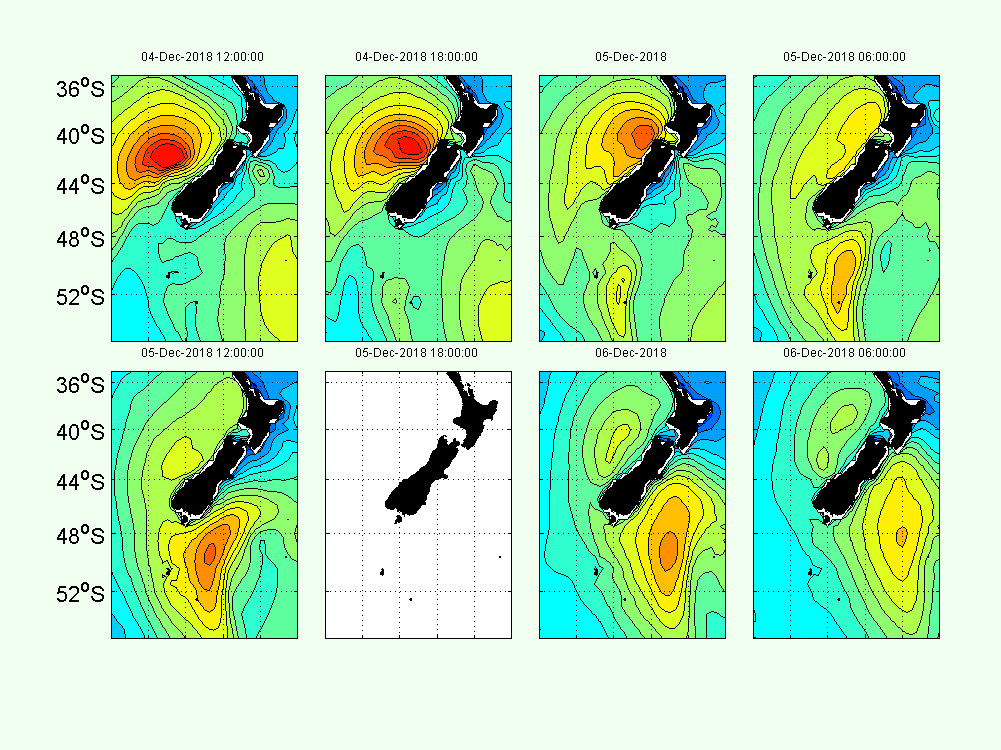
The maps below are for the event 06-Dec event shown above when the peak in the hum preceded the peak in the waves at Steep Head.
The maps show contours of wave height from zero (blue) up to 8 m (red).
Unfortunately, the data are missing for 18:00 on 05-Dec.
Examination of the swell maps shows that the peak in hum occurred when there were huge waves pounding the west coast of the South Island.
This means that the effect of that has propagated 250 km to Port Levy.
The large waves measured at Steep Head are shown propagating up from the south later on 5-Dec and into 6-Dec.
By then, the waves on the west coast had died away, along with the hum energy.
The largest hum event occured on 01-Feb-2018, as shown below. The peak energy in this event was more than twice the energy in the next largest event.
The swell maps below show once again that maximum hum occurs when waves are pounding the west coast 250 km away.
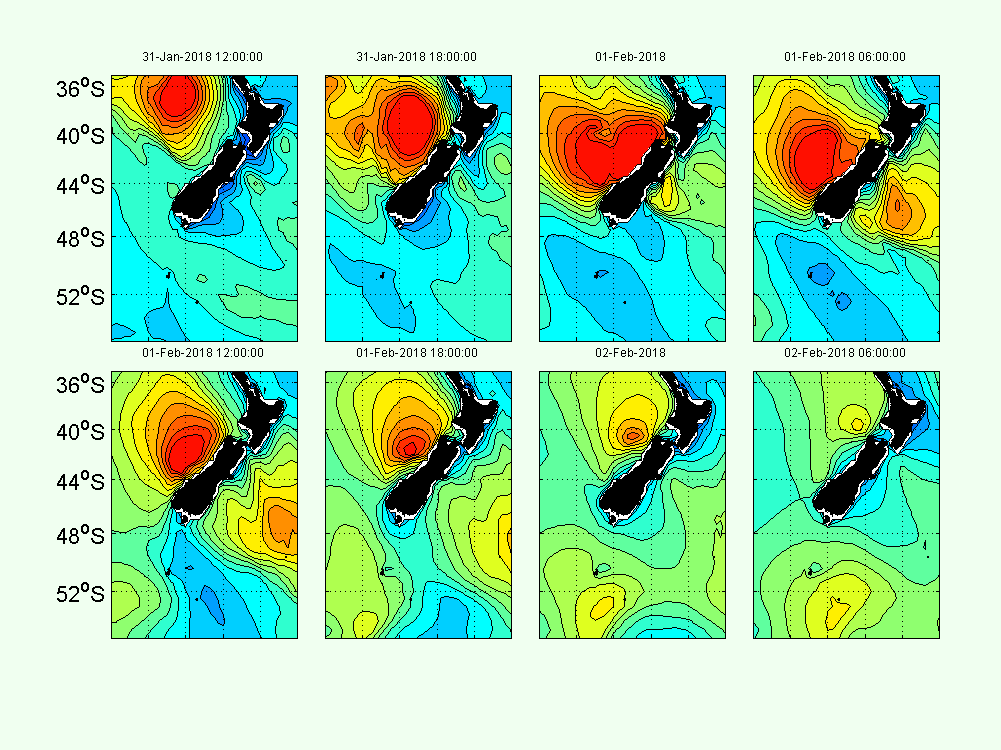
Eight hum events were identified when the peak hum exceeded 0.75 and they all corresponded to large waves hitting the west coast.
Weather Systems
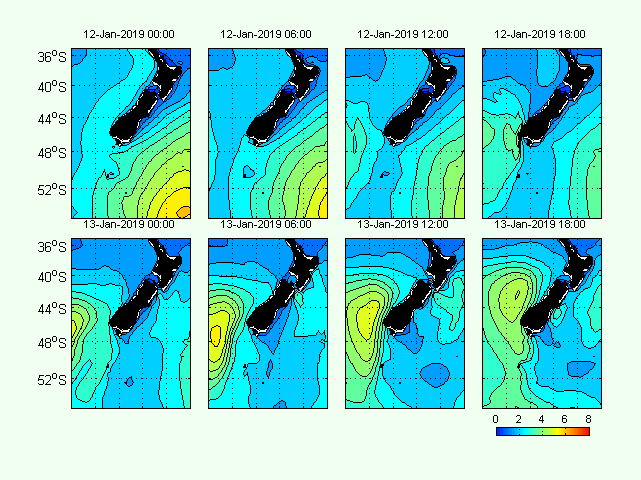
Here is a different sort of microseism event.
Between 06:00 and 12:00 on 13-Jan, the
energy increased rapidly, then it died away over the next day or so.
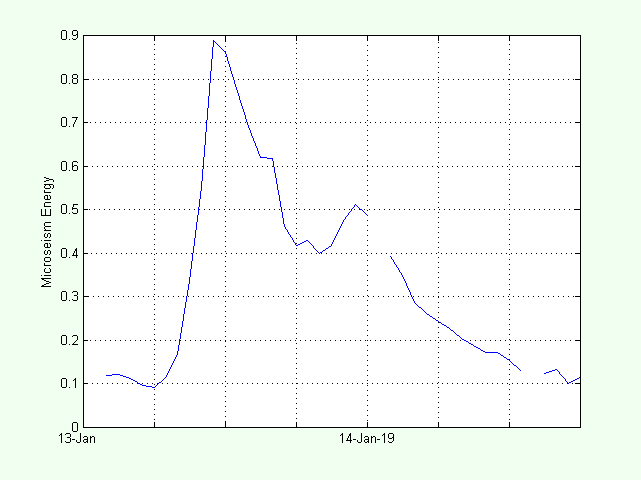
But looking at the swell map, this event does not fit with the other events observed in 2018.
There are waves hitting the SW corner of the South Island, but they are small compared to the waves
that occurred in other events.
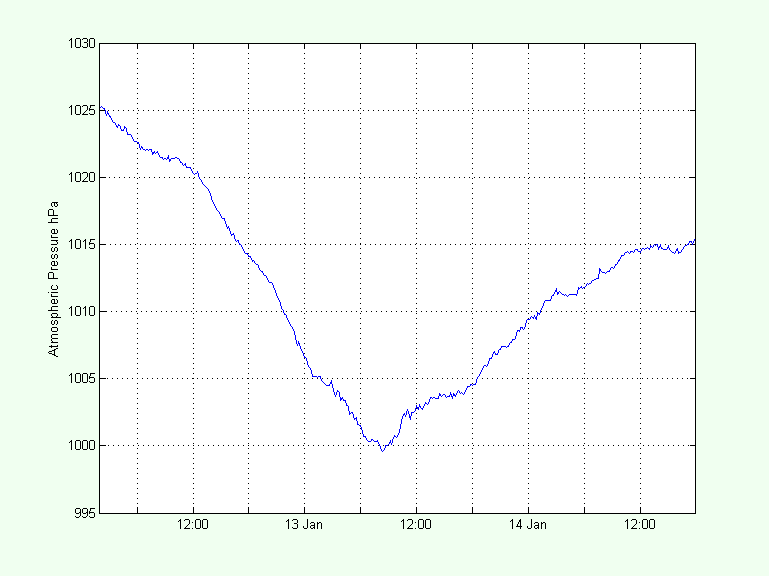
At the time, a southerly front passed through and the atmospheric pressure dropped rapidly, then recovered.
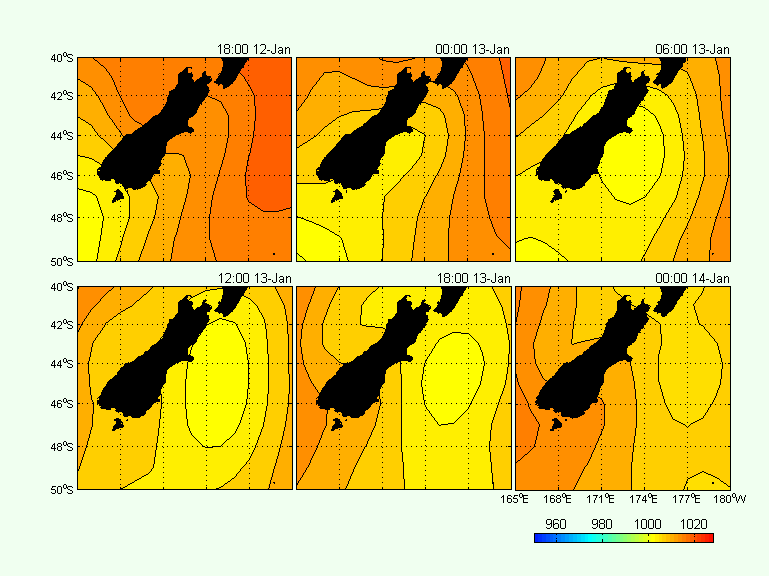
The weather map below shows the passage of the low-pressure system (yellow disc) up the east coast of the South Island, then slipping away to the east.
So, it appears that weather systems also generate microseisms.
A similar event was reported here.
Conclusions
The microseisms (low-frequency hum) measured by the Raspberry Shake at Port Levy are a response to:
- Local waves that are very large (> 6 m);
- Large waves breaking onto shorelines along the west coast of the South Island.
- Low-pressure systems (cold fronts) propagating up the east coast of the South Island
I think it is quite remarkable that swell waves breaking on west coast beaches can be felt on Banks Peninsula 250 km away.
And the instrument that is recording these data is a seismometer that costs not thousands of dollars, but only a few hundred dollars.