In this page, we assess how accurate are the forecasts of atmospheric pressure by NOAA's
GFS model.
We expect that any model should be capable of forecasting atmospheric pressure one or two days ahead
because pressure changes quite slowly.
However, weather is a chaotic process, and for modelling this means that the inital conditions
are paramount in determining what will happen.
Just a small perturbation to these can give quite different results down the line.
And this influence of the inital conditions becomes more pronounced, the further the
forecasting goes into the future.
Therefore, we cannot expect any model to perform well for more than a few days.
The question is: for how far into the future does the GFS model work well?
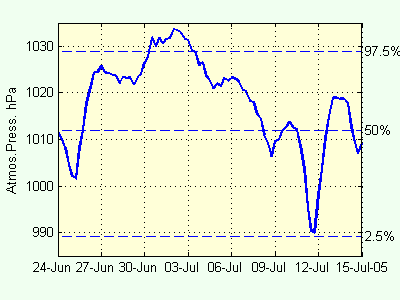 To test this, we chose a 3-week period of record that appeared difficult because it involved
a rise from mean pressure to a peak above the 97.5% level (pressures exceed this for only 2.5% of the time),
then dropped to the 2.5% level and rose again, as shown to the right.
To test this, we chose a 3-week period of record that appeared difficult because it involved
a rise from mean pressure to a peak above the 97.5% level (pressures exceed this for only 2.5% of the time),
then dropped to the 2.5% level and rose again, as shown to the right.
The record is from a node at 175 deg E 36 deg S, 48 km to the ESE of Marsden Point.
Elsewhere
we showed that the "analyses" (the intial conditions for the model) compare well with measurements by barometers.
In this experiment, we compare analyses with forecasts various days ahead.
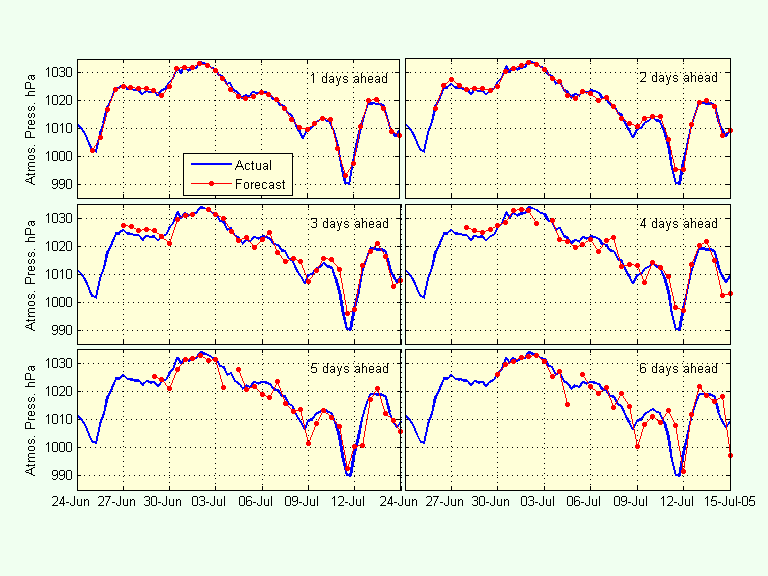
The results are shown in the figure below.
There are 6 plots, each one showing the forecasts for a particular number of days ahead.
Thus, for example, in the plot in the top row at the right showing 2-day ahead forecasts,
each point represents a forecast that was made 2 days before.
The first point to make is that the forecasts are remarkably good, even out to 6 days ahead.
For example, considering the 6-day ahead forecasts (lowest plot on the right), the first point
(30 June) was forecast correctly on 24 June, even though the pressure fluctuated quite rapidly in the
intervening period.
The forecasts tend to oscillate around the actual pressure and the model had trouble getting the time of
the trough on 11 July right, but the shapes of the forecast are generally right, even out to 6 days ahead.
And the small peak that followed the trough is modelled correctly.
 A more objective measure of how well the GFS model performs is its "skill".
The skill of a forecasting model is evaluated by comparing the errors in the forecasts for a large number of data
with the error that would occur if the forecast simply assumed that conditions stayed the same.
Skill is expressed as a percentage, with 100% indicating a perfect model and 0% indicating
the model is no better than assuming conditions don't change.
A more objective measure of how well the GFS model performs is its "skill".
The skill of a forecasting model is evaluated by comparing the errors in the forecasts for a large number of data
with the error that would occur if the forecast simply assumed that conditions stayed the same.
Skill is expressed as a percentage, with 100% indicating a perfect model and 0% indicating
the model is no better than assuming conditions don't change.
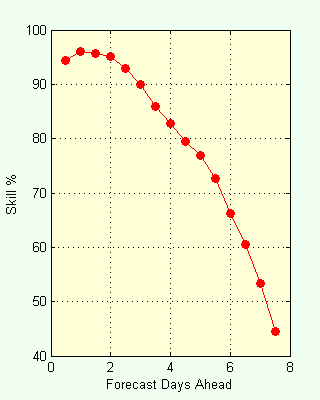
For the node near Marsden Point, we extracted 6 months of forecasts (Jan to Aug, 2005) and calculated the skill for various numbers of days ahead forecasts. The results are shown to the right.
The figure shows that for forecasts up to 3 days ahead, the skill is more than 90%, but thereafter
the skill drops off and for 7-days-ahead forecasts it is only 55%.
Nevertheless, even for 7-days-ahead forecasts, the model is better than assuming conditions stay the same.
Indeed, the experiment has shown that a lot of the deterioration in the skill of the forecasts is due to errors in the
timing of events and that the general shape of the forecast is correct.
An interesting feature of the skill figure is that the 12-hours-ahead forecast has less skill than the
1-day-ahead forecast. We assume this is because at 12 hours, the model is still warming up, and it hasn't
reached its fully operational state.
Both the experiment and the calculation of skill have shown that the GFS model forecasts atmospheric pressure correctly, even out to 6 or 7 days ahead, though the accuracy deteriorates, especially the timing of features. This gives confidence in the use of forecasts of pressure from the GFS model for forecasting the generation of rissaga.